The cubic function. Yes, that’s the ‘S’-shaped graph.
A cubic function has an exponent of 3, as you can tell by the name:
The equation of a cubic is this:
However, we can’t translate that effectively, so we have to use:
Respectively the inflection form, and the intercept form.
..where is the point of inflection. Point of inflections are a point just like the vertex of a quadratic function. It’s where the concavity (similar concepts to gradient) changes.
it’s very similar to the quadratic function — just the exponent swapped.
..The , , stands for the intercepts along the -axis.
Let’s look at this graph:
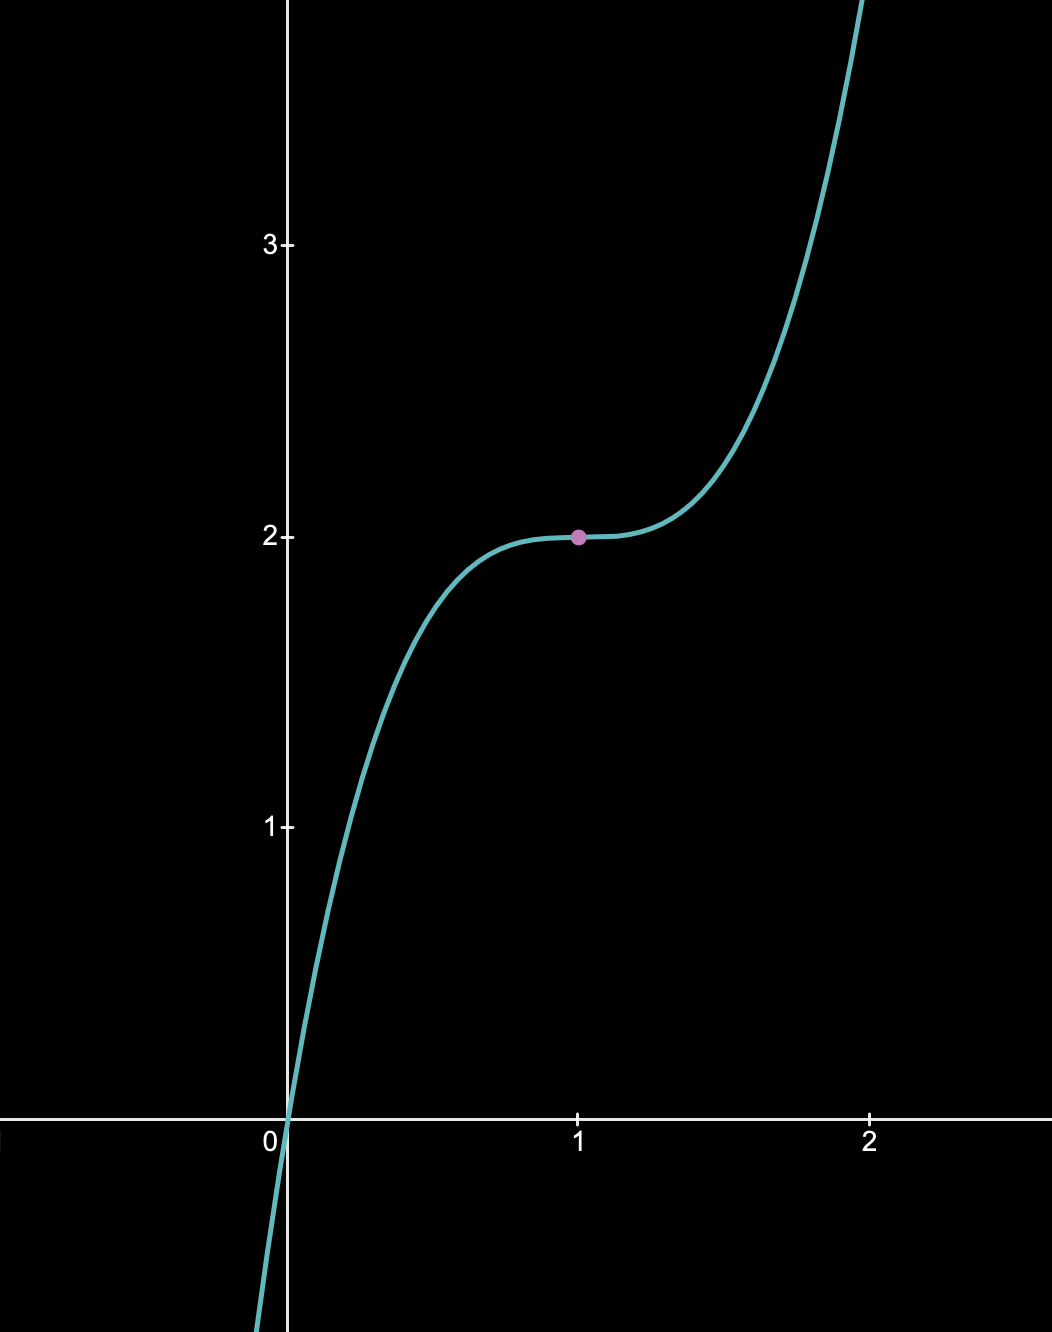
Function is drawn using the inflection form.
As we can see, the cubic function has a point of inflection at marked in pink — since the inflection point’s equation states that is the point of inflection.
Moving onto the next form, we have the intercept form. Unline the inflection point form, the intercept form has a local maximum & minimum (local extrema). This is because when you expand the intercept form, you get a . The makes it so that the cubic have a local max & min (more explanation on calculus using derivatives).
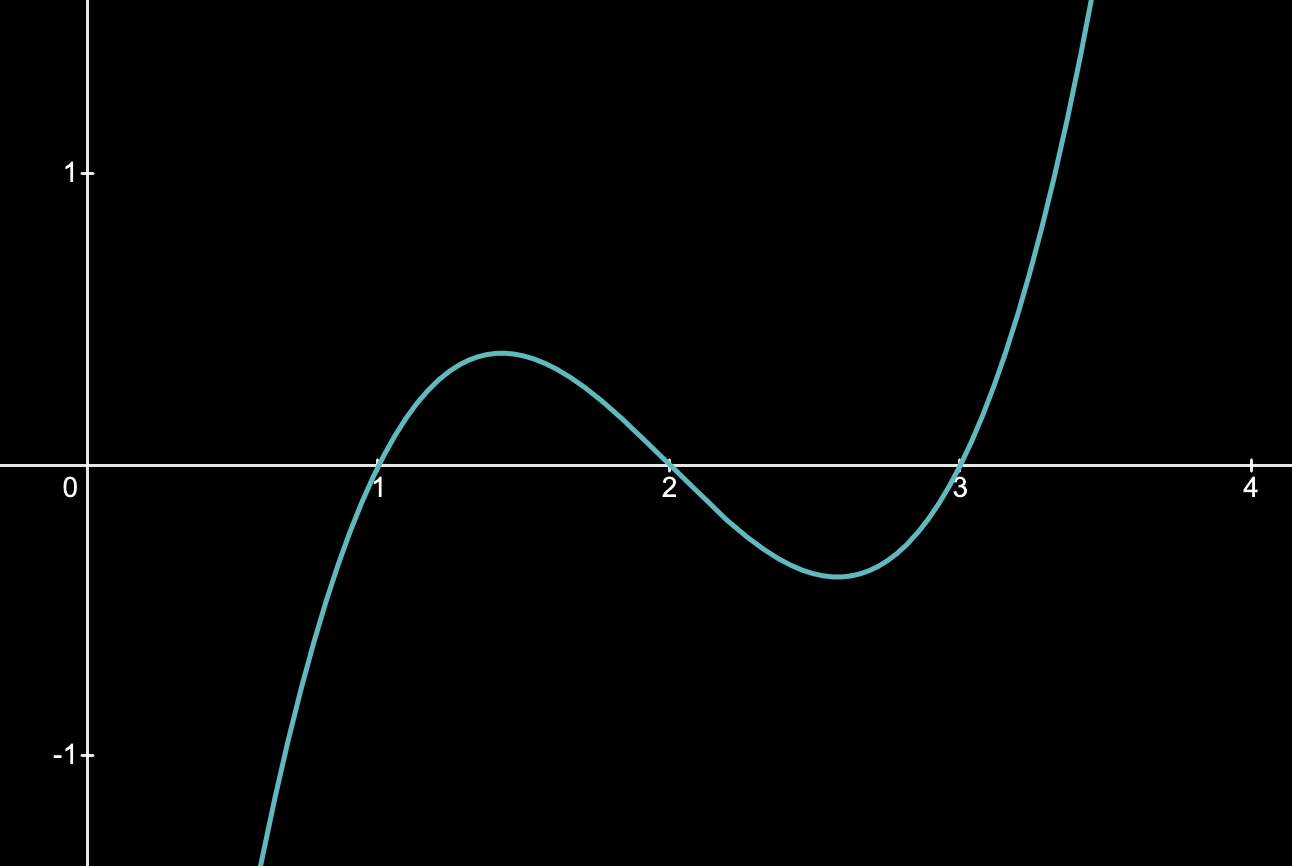
Function is drawn using the intercept form.
As you can see, the graph intercepts the -axis at exactly , and .
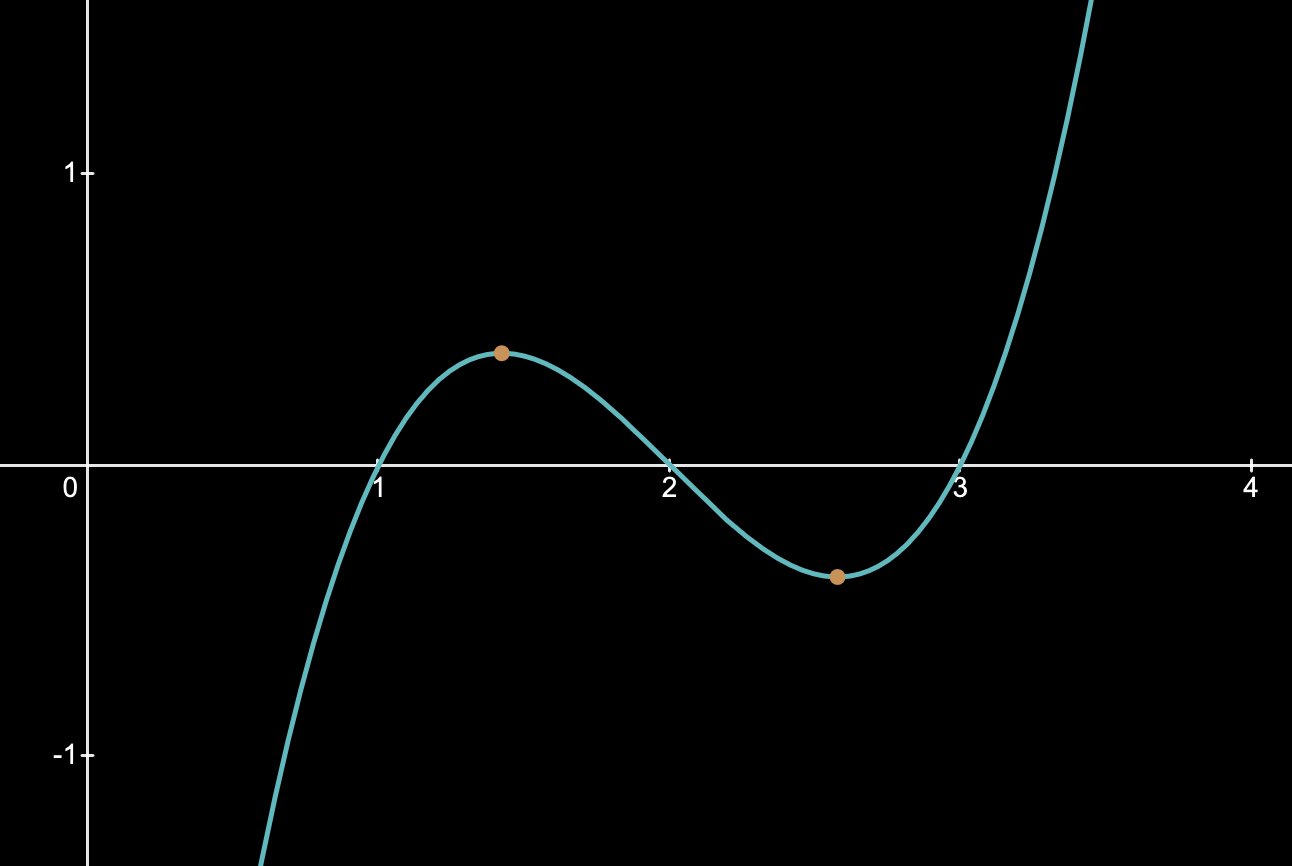
Local maximum and minimums are the points in orange in the image below:
If you draw a gradient (just a straight) along the cubic function:
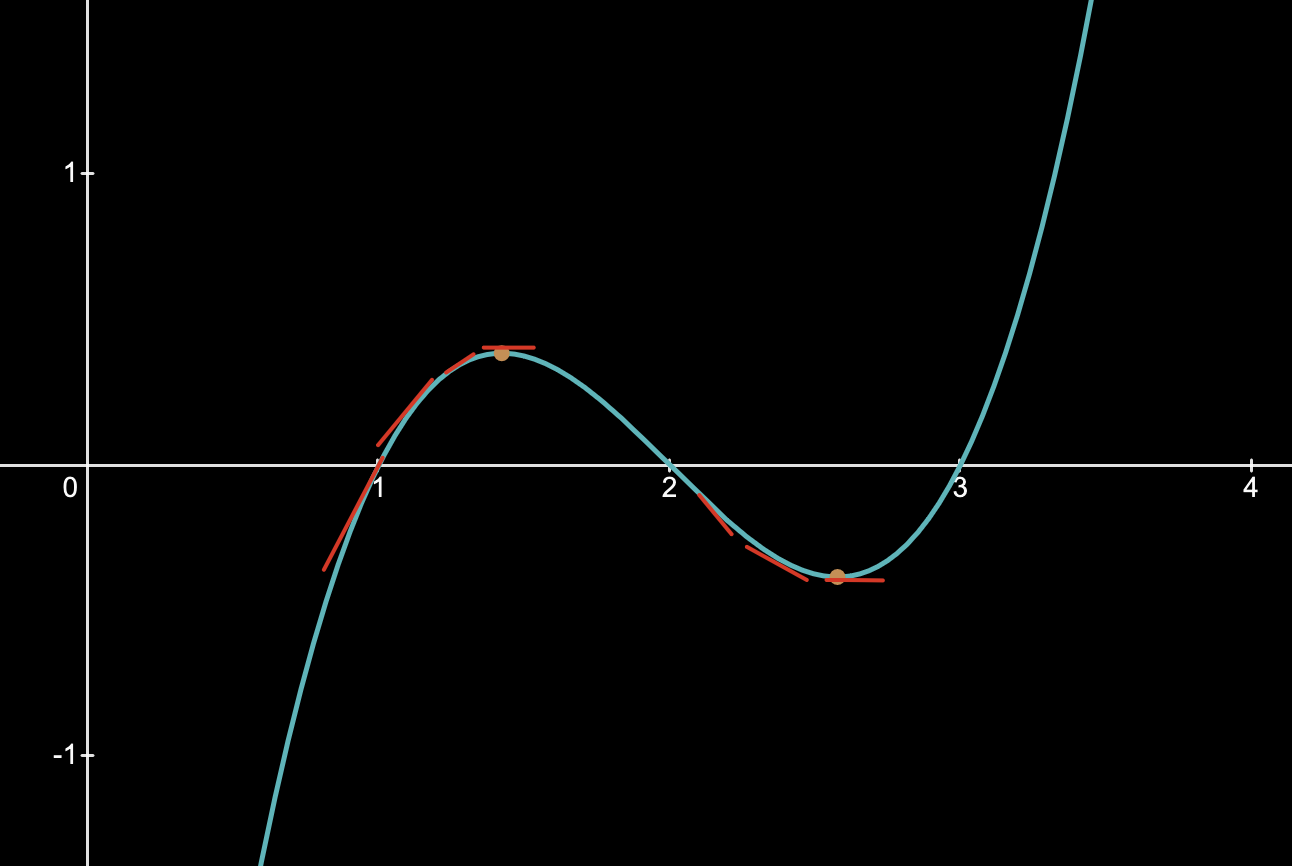
You can see that the gradient becomes 0, as soon as it meets the local maximum and minimum. As you can tell by the name, a local maximum and minimum are the max & min points of a cubic function.
Trends:
Trends are the ones you saw in stats (if you have done it). Is it an increasing trend? Or, a decreasing trend?
We read trends from left to right — like you read a book. On the graphs above, both graphs have an increasing trend, because , the scale factor is in the positives.
If a function has a negative scale factor , then you get a negative trend (try it on Desmos).