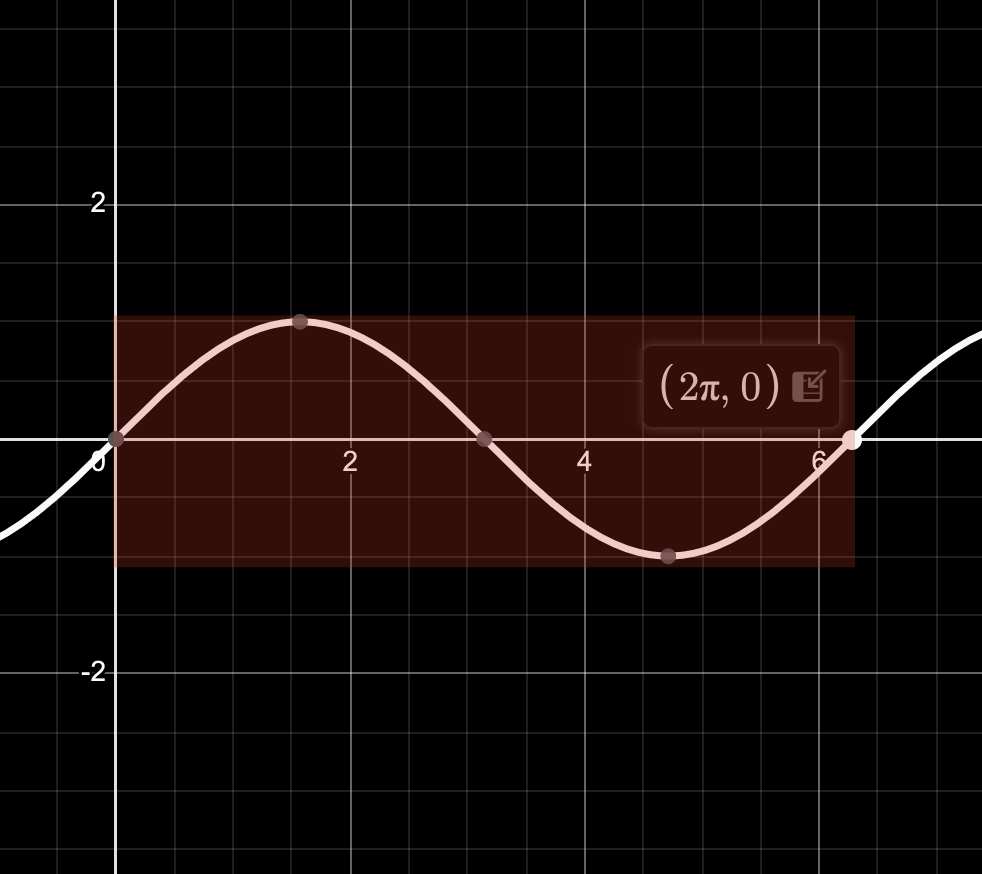
Converting degree to radians
Sine graph when plotted using the equation
Using a table is a very efficient way of finding out what a table looks like.
| 0 | 0 |
| 30 | 0.5 |
| 45 | 0.71 |
| 60 | 0.87 |
| 90 | 1 |
| 120 | 0.87 |
| 135 | 0.71 |
| 150 | 0.5 |
| 180 | 0 |
| 210 | -0.5 |
| 225 | -0.71 |
| 240 | -0.87 |
| 270 | -1 |
| 300 | -0.87 |
| 315 | -0.71 |
| 330 | -0.5 |
| 360 | 0 |
Generic Equation:
Where , is the amplitude, which determines the height (crest) of the graph, marked by a red arrow on the image below:
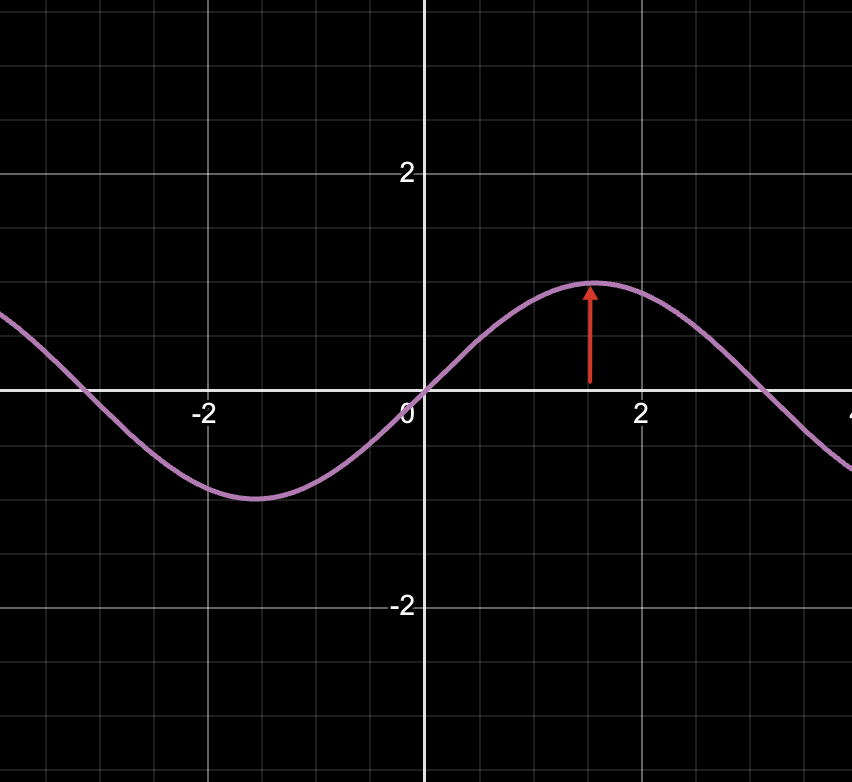
If the amplitude is increased to , the size of the ‘crest’ will change.
While is the frequency, where frequency determines how many the graph concaves up/down within the period. If the frequency is set to a high number, the graph would have more local maximum/minimums.
Moreover, , and can be modified to translate the graph along the and axis.
Period:
Period is a range inside a graph marked by the red range below:
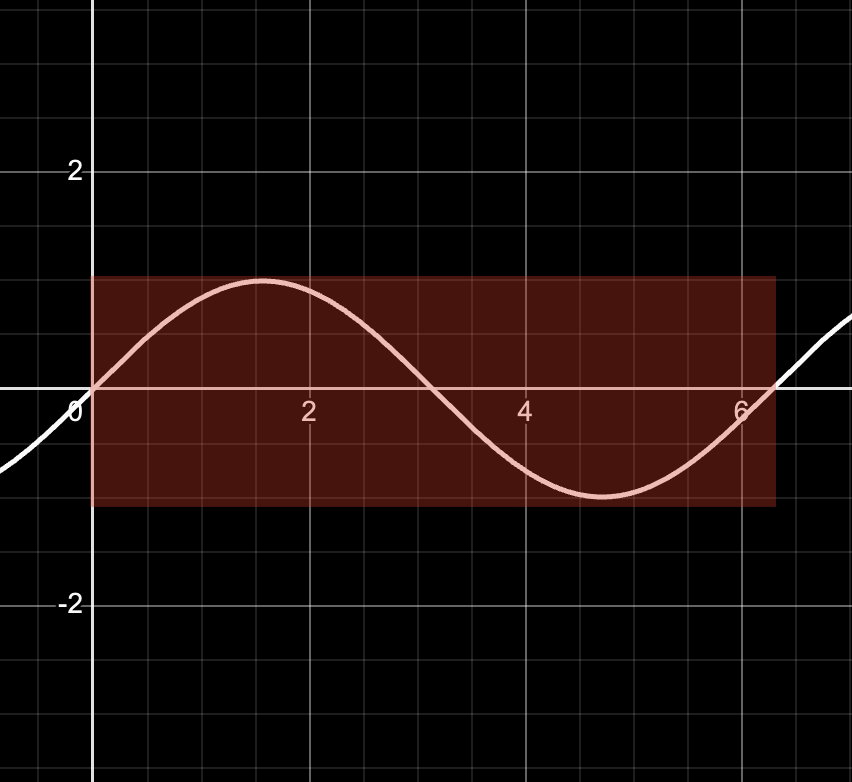
It is the range between the first inflection point to the next next inflection point after going through the local maximum and minimum once.
We can calcualte the period when we have the frequency using the formula:
..where is the frequency of the sine graph.
In this case , the period would be , since the frequency is .