Functions:
A function is a relation in which there are no repetitions of x-values in the coordinate pairs; and yes, it is the you see everywhere in maths, and you finally learn it.
For example:
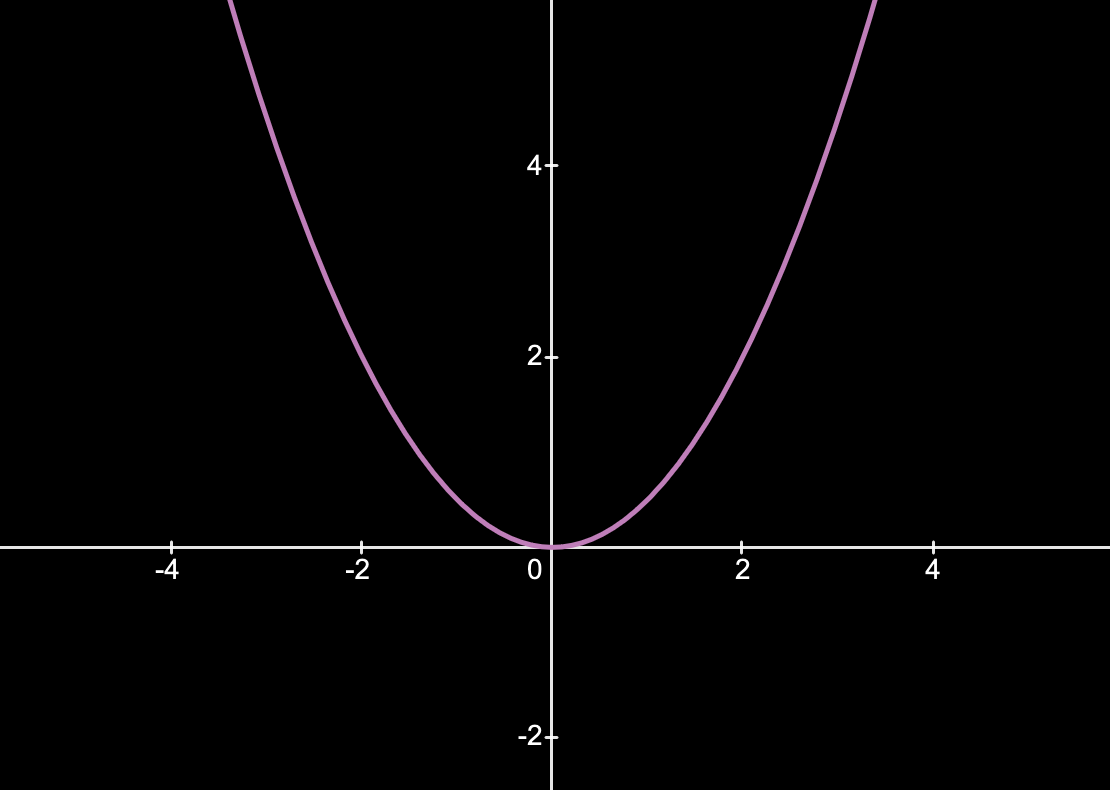
The graph above is an example of a function, as there are only 1 value per corresponding value in their coordinate pairs. It also passes the vertical line test, which will be covered later in this note.
A function must have only 1 pair of value for 1 pair of value (1 → 1 ).
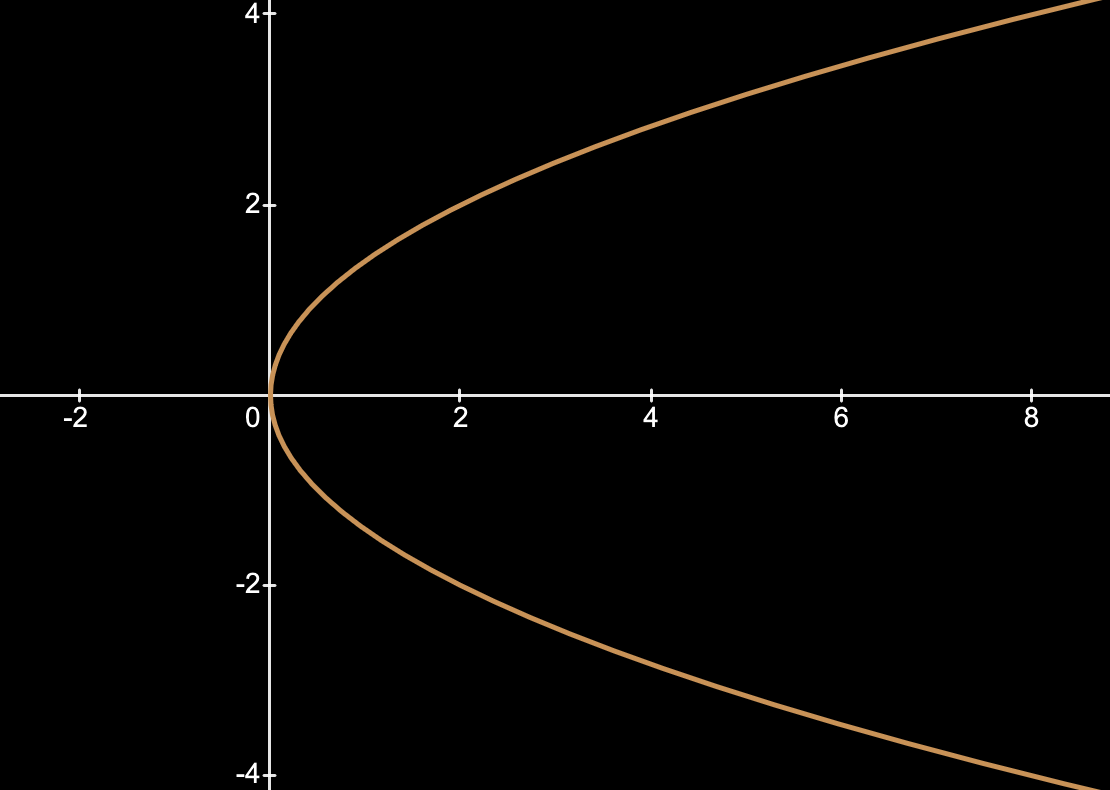
The graph above is not an example of a function, as there are multiple number of values in the same value in their coordinate pairs. On the graph, there are 2 values in the same pair of values.
To find out if a graph is a function or not, we use the vertical line test:
Vertical Line Test (VLT):
Passes VLT? → Function
Doesn’t Pass the VLT? → Not a Function
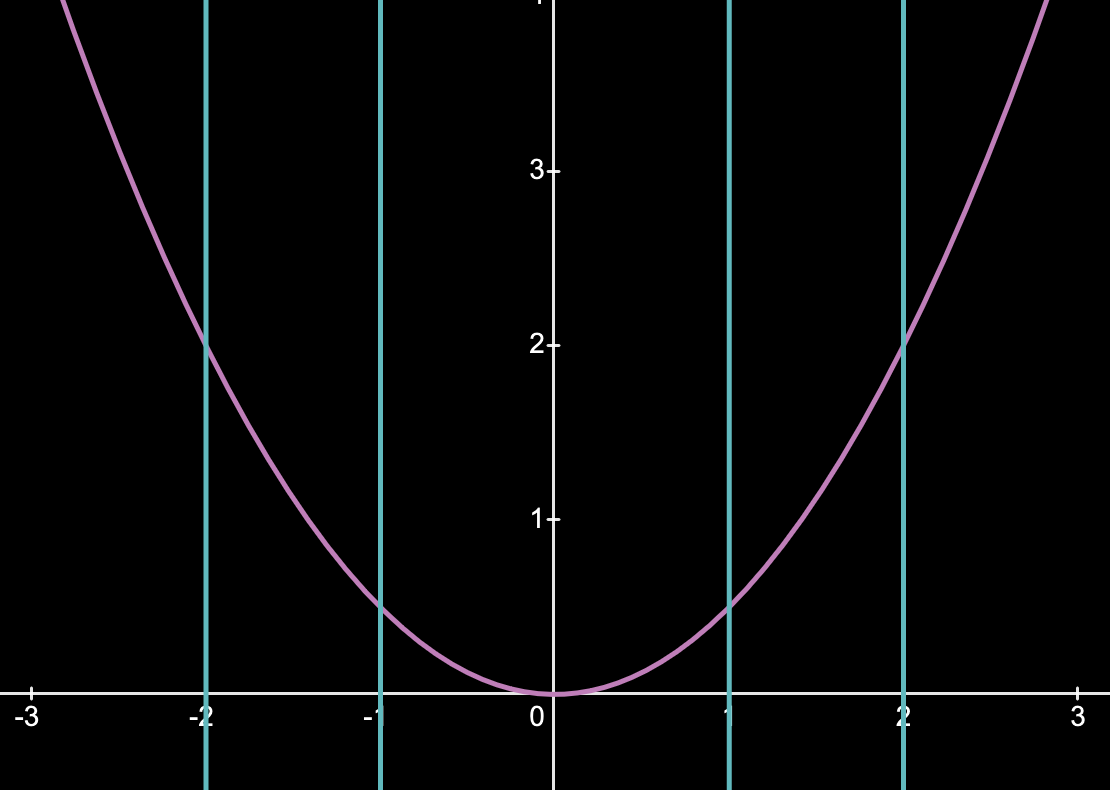
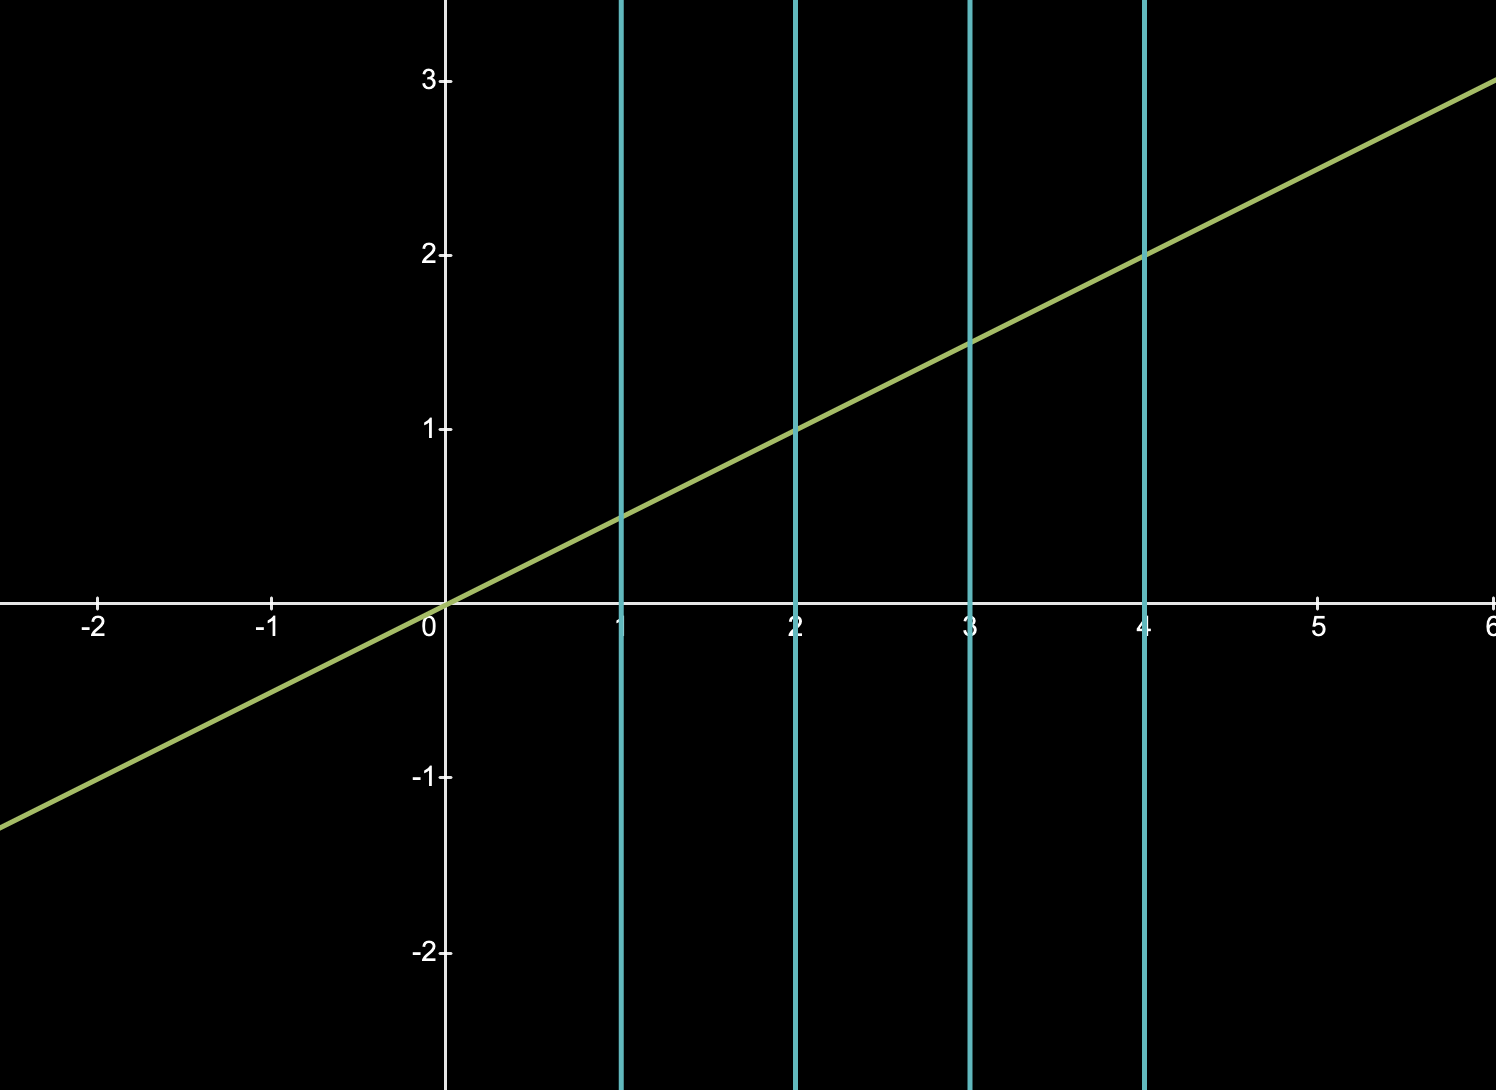
A vertical line testing is where you put multiple vertical lines on a graph to see if the graph intersects the same line twice (or more). As seen from the images, the graphs do not intersect the same line twice or more, meaning it is a function.
Exception: if you do use a linear line in the exam, those won’t be marked (even though it’s a function)
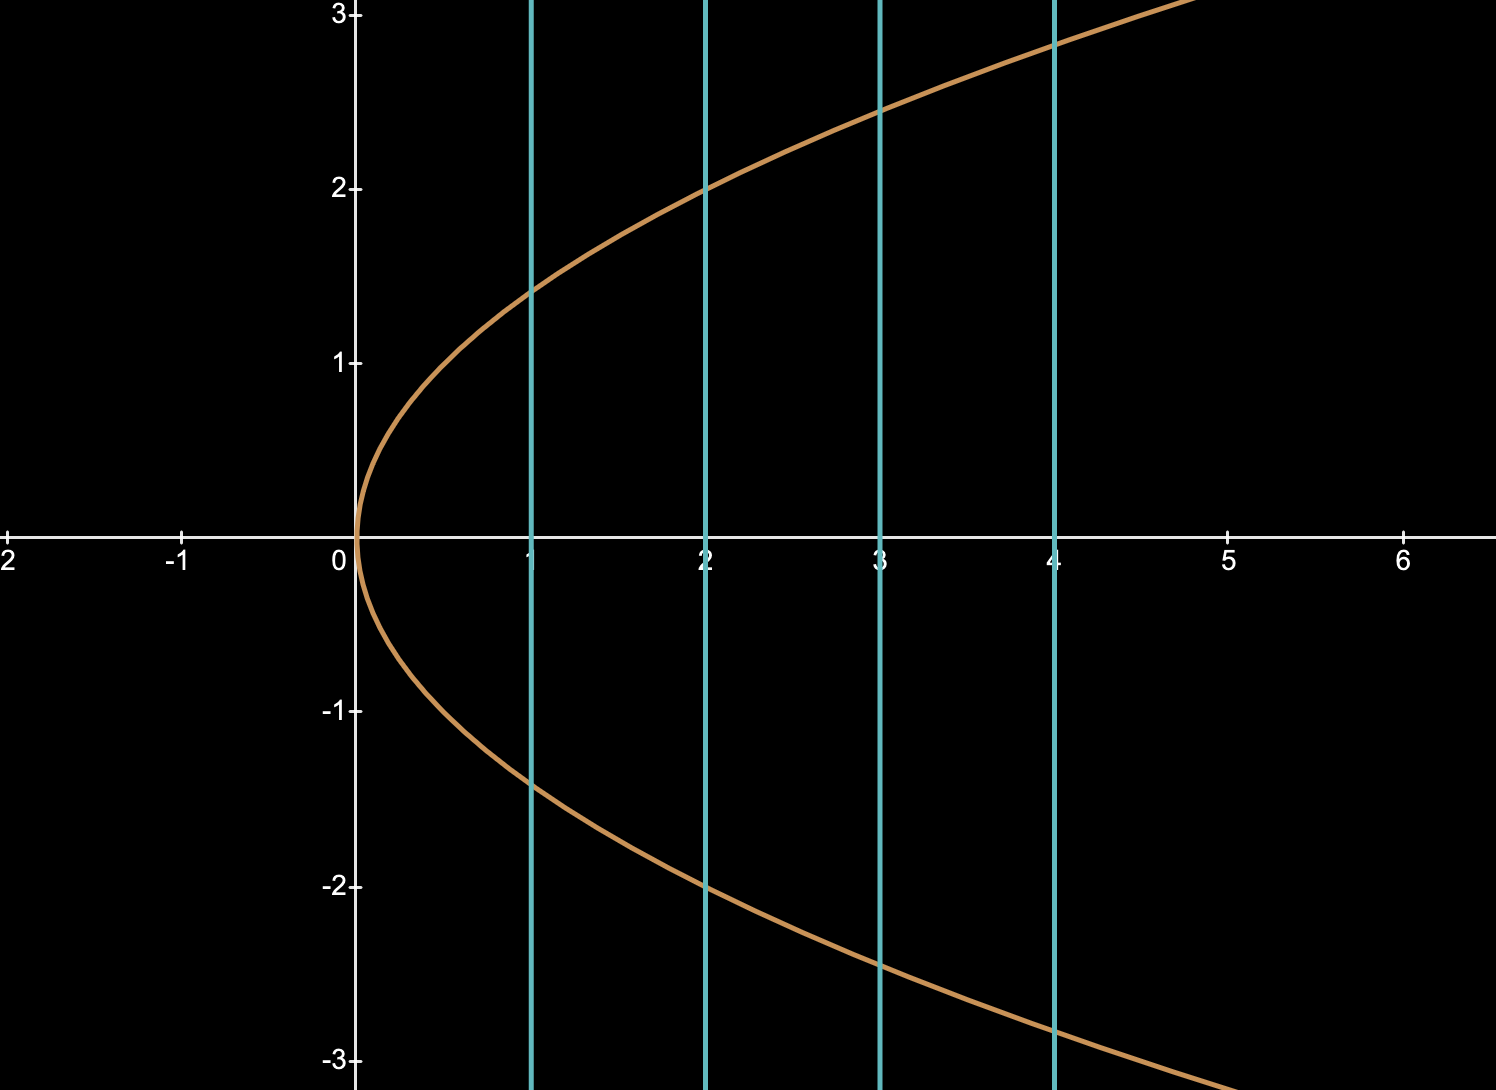
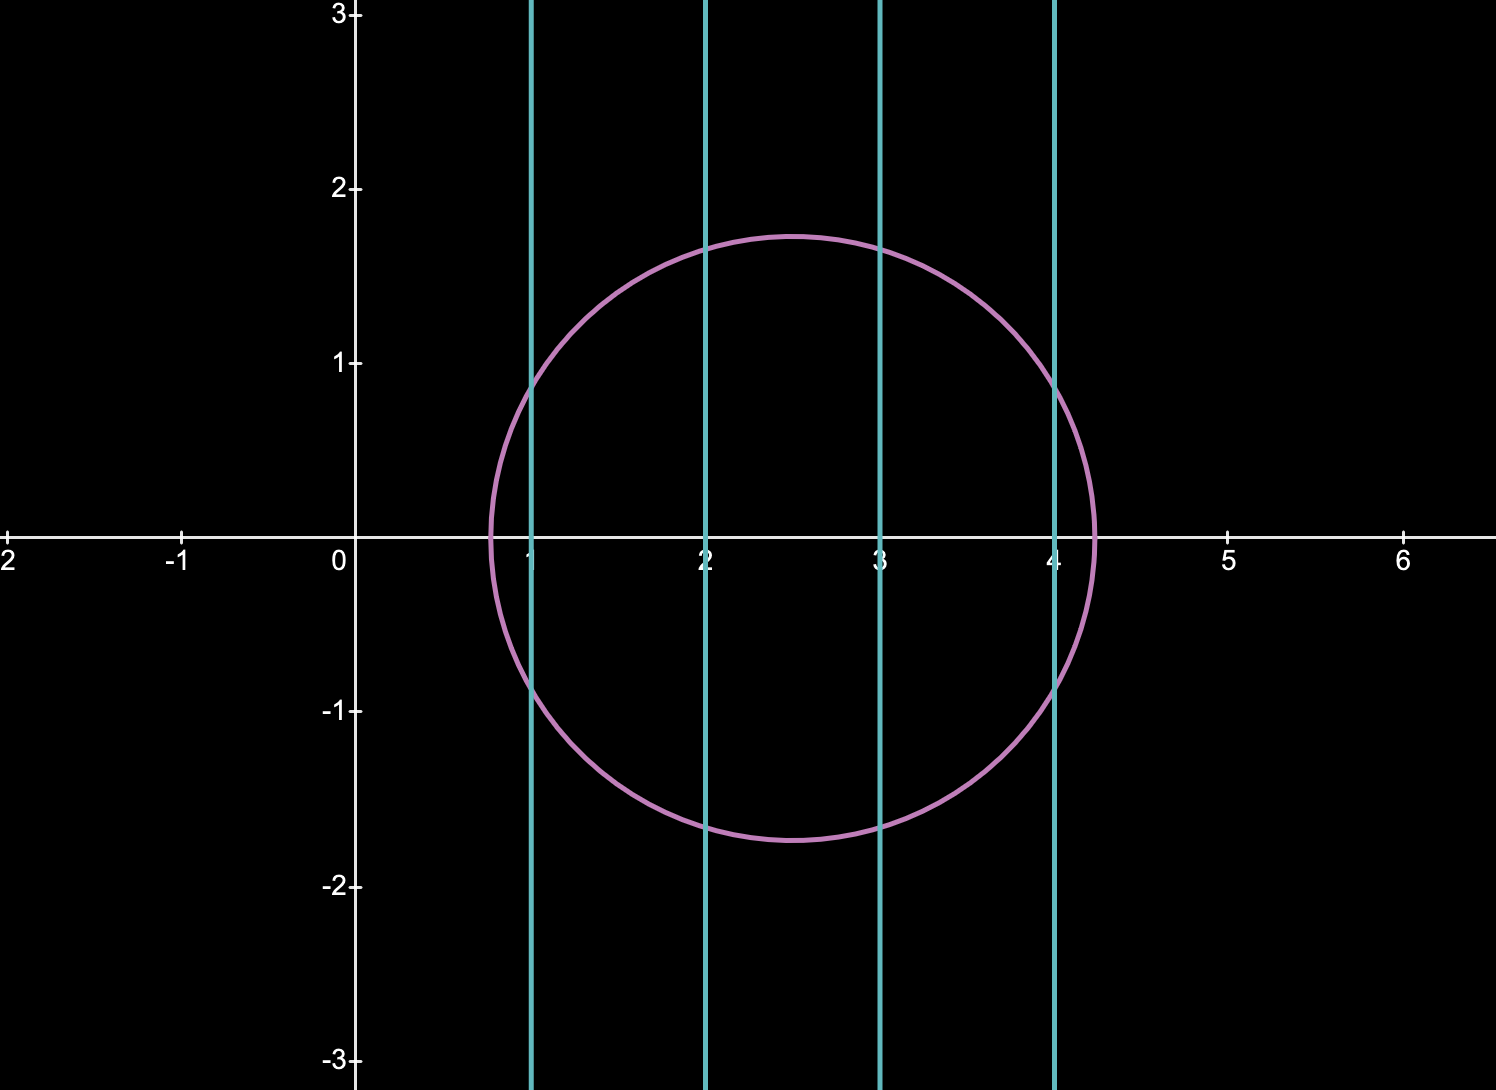
These graphs fail the vertical line testing, as the graphs (orange and pink) intersects the same line twice, as well as all other lines. This means that this graph is not a function.
However, if you restrict them, in terms of using domain & range, which will be covered later, they can indeed be a function as there will be no repeating values.
In very easier words, if you can express it in the form of , it is a function (most of the time)
You have to use at least 4 functions in the exam (3 minimum, but 4 as safety). You may use linear lines but those will not be marked. You cannot use non-functions.
Domains & Ranges
Domains and ranges are used when you’re restricting your functions, like, cutting them so that it doesn’t go past a certain value. , might be something you probably saw on websites like Desmos, or any other resources.
Restricting the value is restricting domain, and restricting the value is restricting the range.
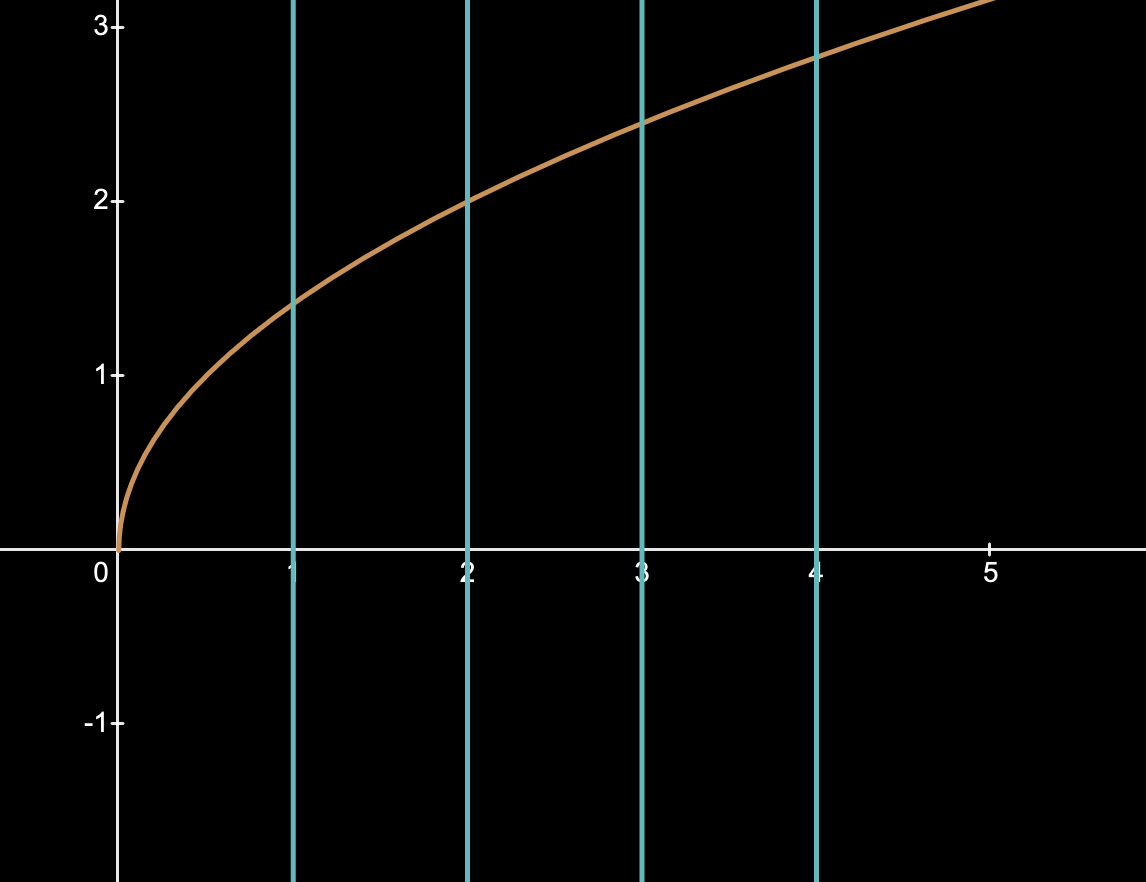
( )
In the function right above (same function without range is quite above as well), the range is restricted to ’ must be equal to or over 0’, to make the graph a function. Using a vertical line test, we can see that this is a function as there are no repeating values, thus passing the VLT.
By restricting the domain/range so that it does not produce repeating values, we can make this a function.